
I recently learned something that I found comforting – it’s called Amara’s law, and it states:
“We tend to overestimate the effect of a technology in the short run and underestimate it in the long run”.
For me, it means that no matter how much hype there is over any trendy new thing, all development is still going to be steady and stepwise. Your competitor isn’t going to win the race tomorrow by adopting this or that today. If your business is in otherwise healthy condition, I can assure you that you haven’t missed the train on anything.
There are, however, real, observable developments that shape industrial information management, creating both challenges and opportunities. Below, I’ll highlight a few key trends in industrial data. Then I’ll introduce you to Information Architects and how they can contribute to your organisation. In the end, I’ll reflect on how good information architecture can help you navigate the waves set in motion by the current industry trends. A robust foundation doesn’t stop the waves, but it helps you ride them with intention and direction. The future is uncertain, but change is guaranteed.
Traceability and supply chain transparency
There is an increased demand for traceability and supply chain transparency. In Europe, this is driven by new EU regulation that aims to improve sustainability through more detailed, quantifiable, and comparable environmental, social, and governance (ESG) reporting requirements. The acronyms related to this are plentiful: EUDR, CSRD, ESRS, CSDDD, ESPR, DPP, and so on. Regulation isn’t just a new cost for your business – in future, you can find new competitive advances from a lower carbon footprint or how conveniently you share your product data up- or downstream. This is already visible on the macroeconomic level, where sustainability-related factors significantly influence the flow and stock of foreign direct investment, with environmental indicators explaining up to 63% of FDI evolution in the EU (Dornean et al., 2022; Voica et al., 2016). Read more from Sustainability data – Should you give a f? blog post.
Post-pandemic, we’ve all grown more aware of how fragile global supply chains and even geopolitical stability can be – this is another driver for traceability. “Resilience over cost” is the new motto when companies select suppliers and supply chain partners.
Opportunities of real-time analytics
Then we have the widespread adoption of real-time analytics. Big data and its (semi-) real-time handling used to be a privilege of big tech companies. Some technologies behind it have matured and become widely available, making real-time analytics affordable for all. Technological enablers here are, for example, data streaming, edge computing, IoT sensors, 5G, and cloud hyperscalers. Cloud computing is especially significant – it has made fast experimentation with state-of-the-art analytics solutions (machine learning, AI, generative AI) possible with low up-front investments. Real-time analytics makes many cool things possible, for example: adaptive manufacturing, predictive maintenance, dynamic pricing, JIT 2.0, improving overall equipment effectiveness, and so on.
BS bingo: digital twins
The previous paragraph ties into the discussion on digital twins. That term annoys the heck out of me! First, it means so many different things – is it a 3D live simulation of your factory? Or is it a real-time dashboard of IoT data? Some sort of AI predictive model?
Secondly, I’ve been designing information systems for over 20 years, and they’ve always mirrored real-life processes, artifacts, and information – what’s the novelty? I do like the image “digital twin” conjures in our heads, but that’s about it. (If you want to read a more optimistic view on the topic, here’s Jonne’s take on it: Short introduction to digital twins).
IT/OT convergence
Closely related to the technology trends above is the unification of previously separate information and operational technologies (or “IT/OT convergence”, as us fancy folks like to call it). Operational technology is getting more and more connected to the company’s other systems and the cloud. This has many implications for analytics and cybersecurity – new opportunities on the analytics and control side and new risks as additional systems get connected to the net. This change also has an organisational effect, as it necessitates discussions on responsibilities and co-operation between the formerly siloed functions.
Servitisation
And lastly, there is servitisation. Servicing your own products is an enticing business proposition for manufacturers as they can offer the customer the best product knowledge, and likely produce the service with higher margins than 3rd parties. This is a prime example of successful vertical integration (if you had that term on your BS bingo card, congrats!). Maybe the success of the Software-as-a-Service business and its steady subscription revenues have been an inspiration as well?
That said, servitisation tends to be most relevant in discrete manufacturing, especially for companies with complex, service-oriented products like industrial equipment, vehicles, or medical devices. It’s less directly applicable to bulk manufacturers or process industries, where products aren’t typically serviced in the same way. Still, for those who can implement it, the predictable revenue streams that come with service contracts or subscriptions can act as a buffer during recessions or demand dips—an increasingly attractive trait in uncertain markets.
Who are the Information Architects?
We are your librarians
Getting on any of the previous trends is going to mean investing in new software and/or data capabilities. Solid information architecture (IA) is a foundation that you want to have in place before you embark on any new systems project. If you aren’t familiar with IA, we Information Architects are both the librarians and the translators of the business technology world. We ensure that your company has a solid understanding of its own information assets. We also try to keep them in some sort of order so that they can be accessed. That’s the librarian’s role.
We are your translators
The translator role comes into play when our IA works’ outputs are used in organisational or systems development. It is here, where you’ll need someone to translate your business concepts and processes to diagrams and documentation that both you and your developers understand. If you haven’t already practised good information (or enterprise) architecture, you can count yourself lucky if most of your business knowledge isn’t in your employees’ heads and only there.
If you’re interested in enterprise architecture and modelling, you can read more from this great article by JP: Anatomy of enterprise modeling or download our guide on Learning architecture.
ISO-9001 certified companies have their processes documented as standard operating procedures, but if we’re honest… Do they paint a realistic and up-to-date picture of how your company is run in practice?
Gone are the days when data analytics meant just pulling a monthly revenue and margin report from Crystal Reports or compiling it in Lotus 1-2-3. As analytics expands across the organisation, orchestration becomes critical – without it, analytics can quickly spiral into, well, a big mess, a liability, a drag on agility. The translation work between analytics and business teams – and facilitated by Information Architects – often takes shape in the form of data catalogs: curated inventories of available data assets, with context, ownership, and usage guidance. Alongside other core IA assets—like concept maps, entity–relationship diagrams, and enterprise glossaries—data catalogs help lay the foundation for developing robust data architecture.
We have many blog articles on data catalogs, check out:
Data catalogs are dead! Long live data catalogs!
- Data catalog project isn’t a technology project! and
- Data catalogs inspire and make data economy easier
We help you capture and transfer knowledge
When you’ve been with the same company for years, it’s easy to see your way of doing business as the natural order of things. Or you may see it as tacit knowledge – something that can only be transferred through years of experience. But when someone new joins your team – or when you try to onboard a consultant, launch a new system, or hand off responsibilities – you start to realise just how much depends on people “just knowing things”.
The way decisions get made, how exceptions are handled, where that one undocumented spreadsheet lives… It’s all perfectly normal until you try to explain it. That’s when you see how fragile and fuzzy your internal understanding really is. And that’s exactly where information architecture starts to show its value: not by inventing something new, but by making the existing knowledge explicit, structured, and usable.
How do we get there?
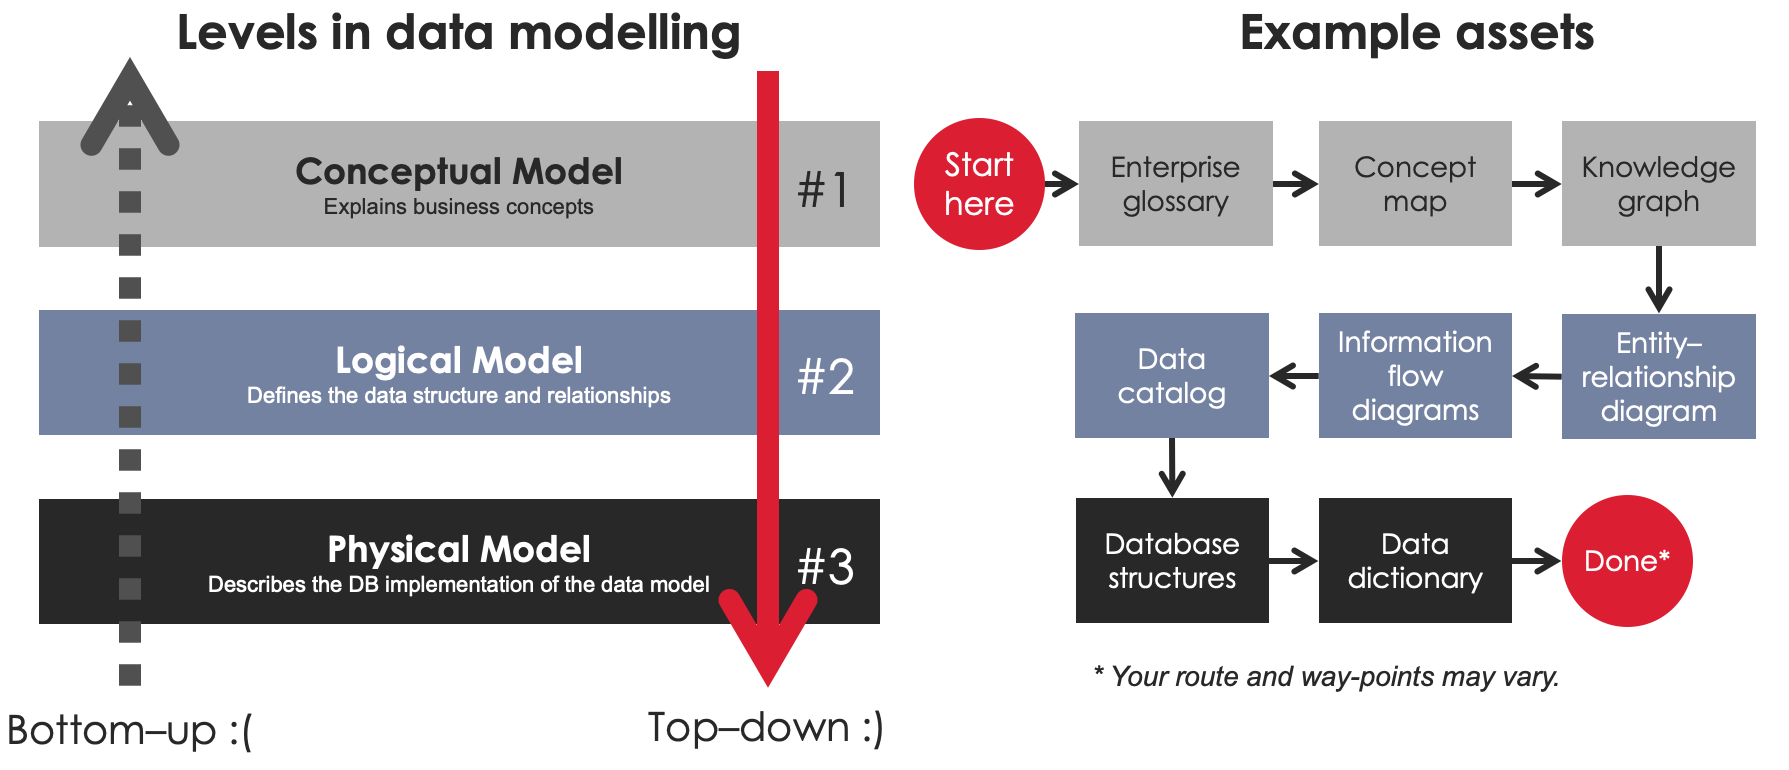
Information architecture is typically approached top–down, starting from the conceptual level and working toward the technical. This method brings clarity early on and helps ensure that business meaning isn’t lost in technical details. The diagram below outlines the typical layers and some common deliverables along the way:
Conceptual layer – We begin by defining core business concepts and establishing a shared vocabulary. This often results in assets like:
- Enterprise glossaries (terms we agree on)
- Concept maps (how ideas connect) and
- Knowledge graphs (structured webs of meaning)
Logical layer – Next, we describe how information is structured and flows across the organisation. Deliverables here help bridge business and systems:
- Information flow diagrams (how information moves between people, processes, and systems)
- Entity–relationship diagrams (how business objects relate) and
- Data catalogs (what data exists, where, and how to access it)
Physical layer – Finally, we get into the technical implementation. This layer is where information and data architectures intersect. It focuses on how data is stored and maintained:
- Data dictionaries (what’s in each field, table, or column) and
- Database structures (the physical layout of the data)
Wow – that’s quite a list of intimidating, jargon-heavy terms, right? But don’t worry. Despite the terminology, these are ultimately tools for communication. They’re not esoteric diagrams for architects only – they’re practical ways to make sense of your business information and align people around it.