The Finnish Transport Infrastructure Agency
Location-based analytics solution supports fairway planning
The Finnish Transport Infrastructure Agency wanted to get a more up-to-date and comprehensive overview on the use of Finnish waterways: how much fairways are used, what kind of vessels use them and what their draughts are.

Solita developed a customised, location-based solution with multiple data sources. The end user can access the data on an easy-to-read Tableau desktop. The solution primarily supports and enhances fairway planning.
-

Simple technology and functional layout guarantee a pleasant user experience.
-

An up-to-date snapshot helps with analysing fairway maintenance and development, such as the need for dredging.
-

Accurate data supports and enhances the planning of new fairways.
-

By observing whether vessels follow the existing fairways, it’s possible to change fairway alignments. These changes improve safety.
-

Vessel observation data is processed in a way that it can be used in applications other than Tableau, or distributed to stakeholders.
In waterborne traffic, The Finnish Transport Infrastructure Agency is responsible for the development and maintenance of Finland’s waterways and canals. In total, the agency maintains about 16,300 kilometres of coastal and inland waterways. In addition, they maintain more than 25,000 maritime aids to navigation.
Waterway maintenance includes fairway planning and surveys as well as dredging activities. Planners need accurate data on the use of fairways and fairway areas, but such data has been available mainly for individual projects. When a data solution for the agency’s needs didn’t exist, Solita’s team developed one in cooperation with the agency’s experts.
“The AIS analytics solution has brought us up-to-date data on the use of fairways and fairway areas. The data can be widely utilised in planning and development work Finland-wide,” says Pekka Kinnunen, senior officer responsible for analytics development at The Finnish Transport Infrastructure Agency.
The AIS analytics solution has brought us up-to-date data on the use of fairways and fairway areas. The data can be widely utilised in planning and development work Finland-wide.
Pekka Kinnunen Senior Officer responsible for analytics development, The Finnish Transport Infrastructure Agency
An up-to-date snapshot was missing
Scattered data had been an issue in the agency’s waterway unit. Data on waterway use existed, but it wasn’t fit to support planning on a continuous basis.
Kaisu Heikonen, senior advisor at The Finnish Transport Infrastructure Agency, has been involved in developing systems for the maritime sector. She knows the shortcomings with existing solutions.
“In the past, we’ve used programmes to track maritime traffic movements. But an essential aspect of examining the draughts or speeds on different fairways and fairway sections has been difficult with existing solutions,” says Heikonen.
Solita’s analytics experts were tasked with building a solution that would combine and visualise huge amounts of data and answer critical questions:
- How much and in what way are fairways used?
- What kind of maintenance and development do the existing fairways need?
- Where should new fairways be created? How deep and wide should they be?
- Where and when to apply winter restrictions? Are the restrictions followed?
- How could security be improved?
In the past, we’ve used programmes to track maritime traffic movements. But an essential aspect of examining the draughts or speeds on different fairways and fairway sections has been difficult with existing solutions.
Kaisu Heikonen Senior Advisor, The Finnish Transport Infrastructure Agency
AIS data and fairway area data made visible
The goal of the project was to combine AIS data and fairway area data and to visualise it to users. AIS (Automatic Identification System) is a tracking system based on identification, location and position data automatically shared by vessels.
Snowflake, which effectively processes large data masses, was chosen as the data warehouse. The map would display hundreds of thousands of data points simultaneously. For such visual analytics, Tableau would be suitable.
The Solita team began with AIS observation data, which they processed, prepared and combined with fairway area data. In this way, the team could calculate the usage data of fairway areas, and visualise it along with AIS data and fairway area data on Tableau. The end user desktop has four views: A summary of fairway area use, plus detailed views for vessel tracking, fairway area use and waterway area use. The displays have been developed iteratively based on user feedback.
An essential part of the project has been to define the calculation logic for allocating observations to fairway areas. The agency and Solita have engaged in constructive discussions about, for example, acceptable margins of error and the possibilities to adjust the logic.
Pekka Kinnunen praises Solita’s expertise and solution-oriented approach. “Solita is very familiar with the data and has been able to propose how problems can be solved. Through examples, they illustrated what the observation data looks like, how interpretations are drawn in problematic cases, and what kind of misinterpretations those might lead to.”

“ Solita is very familiar with the data and has been able to propose how problems can be solved. Through examples, they illustrated what the observation data looks like, how interpretations are drawn in problematic cases, and what kind of misinterpretations those might lead to.
Pekka Kinnunen Senior Officer responsible for analytics development, The Finnish Transport Infrastructure Agency
Customised solution supports fairway development and planning
The AIS analytics solution offers accurate data on fairway utilisation rates. The Tableau views reveal the type of vessel traffic that passes through each fairway area. When assessing development needs, the agency has better tools to assess measures and allocate resources with an up-to-date picture.
Detailed analysis of vessel draughts on different fairways and fairway sections is now possible, too. “In the absence of pavements or tracks, the depth of a fairway determines what kind of traffic passes – and can pass – through it. With this solution, we can better serve fairway users,” Kaisu Heikonen summarises.
Heikonen, who’s in a constant dialogue with end users, also praises the look and readability of the views. “Layout looks better than expected, thanks to Solita. The views are very impressive, according to user feedback. ”
The solution will be implemented as a daily tool for fairway planning during autumn 2020. Initially, it will be in internal use, but the data warehouse has been built in a way that it can adapt to other needs, like those of external partners.
In the absence of pavements or tracks, the depth of a fairway determines what kind of traffic passes – and can pass – through it. With this solution, we can better serve fairway users.
Kaisu Heikonen Senior Advisor, The Finnish Transport Infrastructure Agency
See more cases
-
 Matkahuolto Finland’s oldest traffic platform service sheds its skinFinnish bus service and marketing company Matkahuolto wanted to bolster its digital capabilities and create a base for new business and advanced analytics. Solita has been helping Matkahuolto build modern cloud-based data and analytics solutions.
 -
 The Finnish Transport Infrastructure Agency Harja shows where snow removal vehicles and ongoing roadworks areThe Harja system, built together with the Finnish Transport Infrastructure Agency, brings together all data on road maintenance contracts. It shows what is done on roads on a map template, like snow removal, salting, brushing, paving or painting. As a result, the price-performance ratio improves in maintenance.
 -
 Fintraffic Rail Fintraffic Railway is on a data journey towards the most advanced rail traffic in the worldSolita and Fintraffic Railway are using data and analytics to develop world-class rail traffic.
 -
 City Traffic Ltd. Real-time data analytics injects efficiency and punctuality into metro trafficCity Traffic Ltd. (Kaupunkiliikenne Oy) wanted to improve metro traffic control in the Helsinki Region with data analytics and provide the traffic controllers with a new tool for monitoring transit regularity and punctuality.
 -
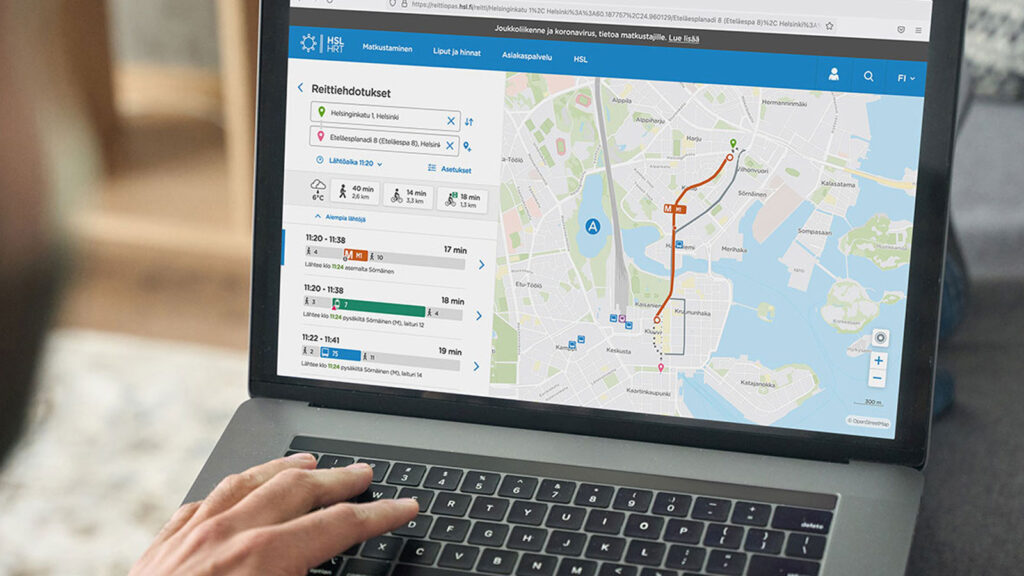 HSL Bringing all services under one roofThe HSL website is Finland’s most used online service for public transport. In cooperation with HSL, we completely renewed the service. HSL clients now have easy access to all mobility information and services in one location.
Want to know more? Contact us!
-

Mikko Varjos Director, Public Business, Solita
[email protected] +358 50 3865 218