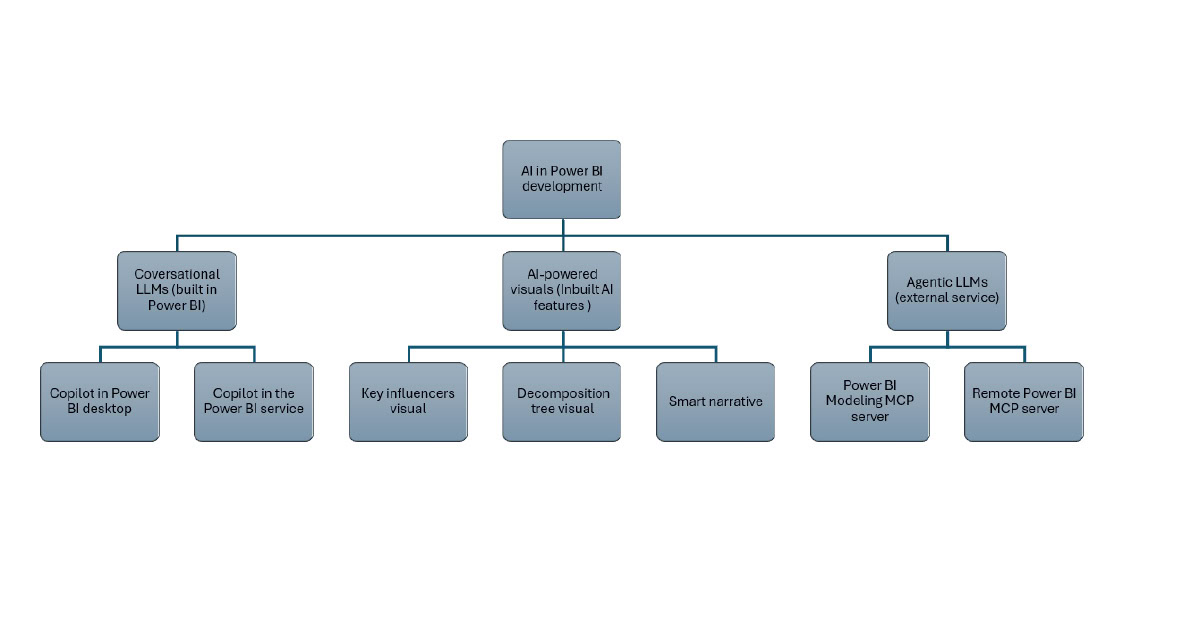

AI inside Power BI
Inside PBI desktop and service, there are built-in AI visuals like the decomposition tree visual for drilling down data into the next dimension in any order based on certain criteria, the key influencers visual for analysing the factors that drive certain outcomes, the smart narrative visual for getting automatic narrative summaries in the report, as well as AI-enhanced features like anomaly detection within line charts. With the introduction of Copilot, a generative AI capability, users can now generate visuals and summarise content through natural language queries. Copilot in PBI will replace the Q&A visual by the end of this year, providing a better user experience.
Copilot brings conversational AI to Power BI
Copilot in PBI helps to create measures, visuals, and report pages based on the prompts. The Standalone Copilot experience in the PBI service helps users to find relevant content, provide summaries across all workspaces they have access to, and assist in creating new report pages quickly by using natural language queries.
Reliable Copilot responses in PBI depend on well-designed data models, dimensional modelling principles, correct data types, and well-established relationships between the tables. Copilot delivers more accurate results when DAX measures are optimised, business logic is clearly defined, and the naming of the column and measure is consistent and business-friendly.
To achieve this, a considerable time must be invested in structured data preparation, including selecting specific schemas to define accessible data elements, validating measures as well as business logic using report visuals, adding customised AI instructions based on the company’s terminology, and creating a linguistic schema with relevant synonyms and descriptions.
Conversational AI provides faster and more out-of-the-box experiences for the user in addition to the traditional report or dashboard. Therefore, continuous training on how to effectively interact with Copilot is required. Maintaining readiness to recognise and implement AI-assisted analytics requires additional investment in training and model development, but this approach enables faster adoption of AI capabilities in future.
Data quality and Power BI best practices are the fuel
Clear ownership and governance of data products, such as semantic models and reports, are important, as AI uses these assets to create content. Following PBI best practices and clearly defining data ownership during development helps maintain the data product lifecycle and ensures reliable AI-generated results. In PBI, AI-assisted analytics can add value to report development and self-service analytics when business processes and report requirements are clearly understood, and the data model is well-prepared. Read more about our blog posts about good Power BI practices.
Agentic AI in Power BI
Agentic AI, such as MCP servers in PBI, provides some actions to the data and models. In general terms, the MCP (Model Context Protocol) server is an open-source standard for connecting AI applications to external systems in a structured, secure manner. MCP in PBI acts like a USB-C port for AI applications, standardising connections in a way similar to USB-C for electronic devices.
In PBI, official Microsoft Power BI Modeling MCP server and Remote MCP server are available. When using GitHub Copilot in VS Code with a Power BI modeling MCP server, VS Code is the host (the work environment), Copilot is the client (helps interpret the requests), and PBI provides the server. When a question is asked or a request for a change is made, Copilot sends the request to PBI, which can read data, calculate results, or make updates in the model. An MCP server interacts with PBI semantic models through the XMLA endpoint, using the Tabular Object Model (TOM) to apply programmatic changes. It’s important to keep PBI files under version control so that it’s possible to undo changes if something goes wrong.
With a remote Power BI MCP server, conversational analytics connect to semantic models via an authenticated endpoint and use read-only queries to retrieve schema, generate DAX, and execute queries without changing the model structure.
Currently, both MCP servers are in public preview and aren’t fully production-ready yet. The MCP server can’t create visuals or modify existing visuals in the report pages. For MCP servers, a security review needs to be done for all systems involved.
MCP servers have the potential to change BI experiences for developers by enabling them to complete tasks such as modifying semantic models (e.g. to create, update, and manage tables, columns, measures, and relationships across PBI Desktop and Fabric semantic models) and executing bulk operations (bulk renaming, bulk refactoring) simply by chatting with their data using natural language queries. With PBI, Microsoft Fabric, and MCP-enabled workflow, it’s possible to bring gold-layer transformations, updating the semantic model and syncing reports, all together in a single VS Code project, instead of managing data transformations in one place and PBI reports in another. When a column is renamed, the gold-layer SQL in VS Code is updated, producing an updated table in the Fabric Lakehouse. An AI agent via the MCP server detects the schema change and updates the PBI semantic model, keeping the report in sync.
However, it’s good to remember that the MCP server still relies on the AI to read or write changes to the semantic model. That’s why it has become more crucial than ever to understand the overall business process and report needs from the end-users, and the ability to break down complex tasks into smaller parts, along with technical knowledge to avoid errors and hallucinations from the AI output.